Most strategic plans I have read start with a vision sentence and end with a list of thirty projects. What is usually missing in between is a simple picture of where the company actually makes and loses money, step by step, from the supplier to the customer. That picture is the value chain, and without it the strategy is mostly a wish list.
In 24 years in manufacturing I have seen the same pattern many times: the management team agrees to grow the newest product family because sales are rising, and a year later the profit is flat. The factory gets blamed first. Very often the factory is not where the money goes. It leaks in logistics, in dealer commissions, in warranty claims, in places nobody put on the same page.
Below is a light way to map the value chain of a manufacturer in about two weeks and turn it into a few clear strategic choices. The company, the product families and every number in this article are illustrative, not data from a real company.
The illustrative case
A manufacturer sells three product families. Family A is the old, stable one and brings 50% of revenue. Family B brings 30%. Family C is new, growing fast and brings 20%. The draft strategy says: invest in capacity for C. Overall, the company keeps about 6.8 of every 100 of revenue as operating margin. Nobody has looked at that margin family by family and activity by activity.
Step 1: draw the chain on one page
Keep it to five or six activities that a manager can recognise without a dictionary. For most plants these are enough:
- Purchasing and inbound material.
- Production (conversion: labour, energy, maintenance, overhead).
- Outbound logistics: packaging, storage and transport.
- Sales and the dealer network.
- After-sales service and warranty.
Write one owner next to each activity. If an activity has no owner, you have already found your first strategic question.
Step 2: put cost on every activity, by product family
Ask finance for one year of costs and split them by activity and by family. Express everything per 100 of that family’s revenue, so that a small family and a big one can be compared. Don’t wait for perfect cost accounting. An hour with each activity owner is usually enough to get within about ten percent, and that is good enough to see the leaks.
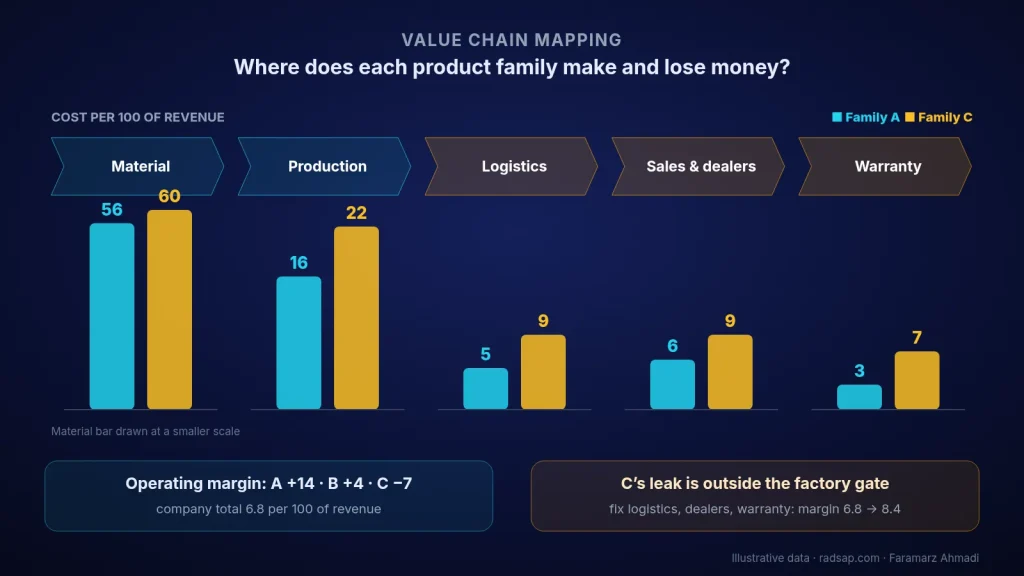
| Per 100 of revenue (illustrative) | Family A | Family B | Family C |
|---|---|---|---|
| Material | 56 | 60 | 60 |
| Production (conversion) | 16 | 19 | 22 |
| Outbound logistics | 5 | 6 | 9 |
| Sales and dealers | 6 | 7 | 9 |
| After-sales and warranty | 3 | 4 | 7 |
| Operating margin | 14 | 4 | −7 |
| Share of company revenue | 50% | 30% | 20% |
Weighted by revenue share, A adds 7.0, B adds 1.2 and C takes away 1.4. Together that is the 6.8 the company sees on its income statement. The growing family, the one the strategy wants to invest in, loses 7 of every 100 it sells.
Step 3: look for the cells that stand out
Production for C is 22 against 16 for A, and the first instinct is to blame the factory. But look at the three highlighted rows. Logistics, sales and warranty for C add up to 25 per 100 of revenue, against 14 for A. Most of C’s gap sits outside the factory gate: bulky packaging shipped to distant customers, a higher dealer commission that was agreed to launch the product, and warranty claims from a design that was rushed to market.
This is the main value of the exercise. It moves the discussion from “the factory is expensive” to “these three activities, with these owners, are where C loses money”.
Step 4: test what one fix is worth
Suppose that within a year C’s logistics, sales and warranty costs come down to B’s level: 6, 7 and 4 instead of 9, 9 and 7. That saves 8 per 100 of C’s revenue, so C moves from −7 to +1. For the company it adds 20% × 8 = 1.6 per 100 of revenue, and the operating margin goes from 6.8 to 8.4, almost a quarter higher, without one extra machine.
Compare that with the draft strategy. More capacity for C, with today’s value chain, would simply sell more of a product that loses money.
Step 5: turn the map into three strategic choices
A strategic plan is a few choices, not a long project list. From this map I would write three, each with one owner, one number and a 90-day check:
- Fix C’s downstream chain before adding capacity: packaging and transport, dealer terms, and the top warranty failure. Owner: the commercial director. Number: C’s margin per 100 of revenue.
- Protect A, because it pays for everything else: keep its delivery and quality steady, and don’t let C’s rush orders push it out of the schedule.
- Review B once a year: 4 per 100 is thin, and it is the first family to slip below zero if material prices rise.
If you already track OEE and wonder why better efficiency doesn’t show up in profit, I wrote about that in OEE went up, profit didn’t. And if you want the bigger picture of activities, systems and owners, start with why enterprise architecture matters.
Checklist before your next strategy session
- Five or six activities on one page, each with one owner.
- One year of costs, split by activity and by product family.
- Every number expressed per 100 of that family’s revenue.
- About ten percent accuracy accepted, so the work takes weeks, not months.
- The cells that stand out marked, especially outside the factory gate.
- The value of each fix tested in margin per 100 of revenue.
- No more than three strategic choices, each with an owner, a number and a 90-day check.
Want to map your own value chain?
Send me one year of costs by product family, even rough and with the names removed. We can split them along the chain together, find the two or three cells that stand out, and leave you with a one-page map and three strategic choices you can take to your next management meeting.
Contact me Read: OEE and profit Read: enterprise architecture
Sources
- The value chain idea, primary and support activities, comes from Michael E. Porter, Competitive Advantage, 1985.
- Splitting cost by activity follows the logic of activity-based costing (Robert S. Kaplan and Robin Cooper, Cost & Effect, 1998). The company, the product families and all numbers in this article are illustrative only.
- Related reading on this site: OEE and profit, enterprise architecture, and finding a production bottleneck with data.