Most investment decisions I have seen in factories were made in one meeting, on one number: the machine price from the supplier’s quote. A few months later the real questions arrive. Is the demand really there? Can we run it at the speed we promised? What did installation, tooling and training actually cost?
In 24 years in manufacturing I have learned that a feasibility study does not have to be a 100-page report from a consultant. For most plant investments, five honest checks on one page are enough to decide go or no-go. It is the step that should come before the project roadmap, not after it.
Below is the light feasibility study I use for a factory investment, with a worked example. The plant, the customer and every number in this article are illustrative, not data from a real company.
The illustrative case
A machining plant is asked to supply a new part family. The customer’s buyer talks about 60,000 parts a year at a price of $14 per part. The existing machining center is already at 72% load, so the production team proposes a second machining center. The supplier quote is $360,000, and the first reaction in the room is: “The order is big, the machine pays for itself.” Maybe. Let us check.
Check 1: demand — believe the contract, not the forecast
A customer forecast is a hope, not a commitment. In this case the signed frame contract covers 36,000 parts a year; the other 24,000 are “expected”. I build three demand cases and never start from the highest one:
- Low: only the signed volume, 36,000 parts a year.
- Base: signed volume plus half of the rest, 45,000 parts a year.
- High: the full forecast, 60,000 parts a year.
The base case is the one the investment has to stand on. The high case is a bonus, not a plan.
Check 2: capacity — at real OEE, and check option zero first
The quoted cycle time is 3 minutes, so the machine makes 20 parts an hour. Two shifts of 7.5 hours over 230 working days give 3,450 hours a year. But a new machine does not run at the brochure speed. I plan the first year at an OEE of 65%, which gives about 2,240 productive hours, or 44,850 parts. That just covers the base case. The high case would need a third shift.
Before buying anything, always check option zero: can the existing capacity do the job? Here, a quick setup-reduction project on the current machine frees about 9,000 parts a year. That is not enough for 45,000, so option zero alone fails, but it is enough to cover samples and the first months of ramp-up. That means the new machine can be ordered calmly, without paying for express delivery. If the bottleneck is somewhere else in the line, find it with data before you buy a machine for the wrong step.
Check 3: cost — the whole investment, not the machine price
The machine is $360,000. Tooling, fixtures, foundation, installation and operator training add $60,000, about 17% on top of the quote. In my experience this part is forgotten more than any other. The total investment is $420,000.
Per part, the price is $14, material is $6.00, and direct labor, energy and tool wear are $3.20. That leaves a contribution of $4.80 per part. The new cell also brings $40,000 a year of new fixed costs: a maintenance contract, part of a setter’s time and spare tooling. Only cash that really changes because of the decision belongs in this calculation. This is the same lesson as in OEE went up, profit didn’t: if the money does not reach the bottom line, it does not count.
Check 4: payback — in scenarios, not one number
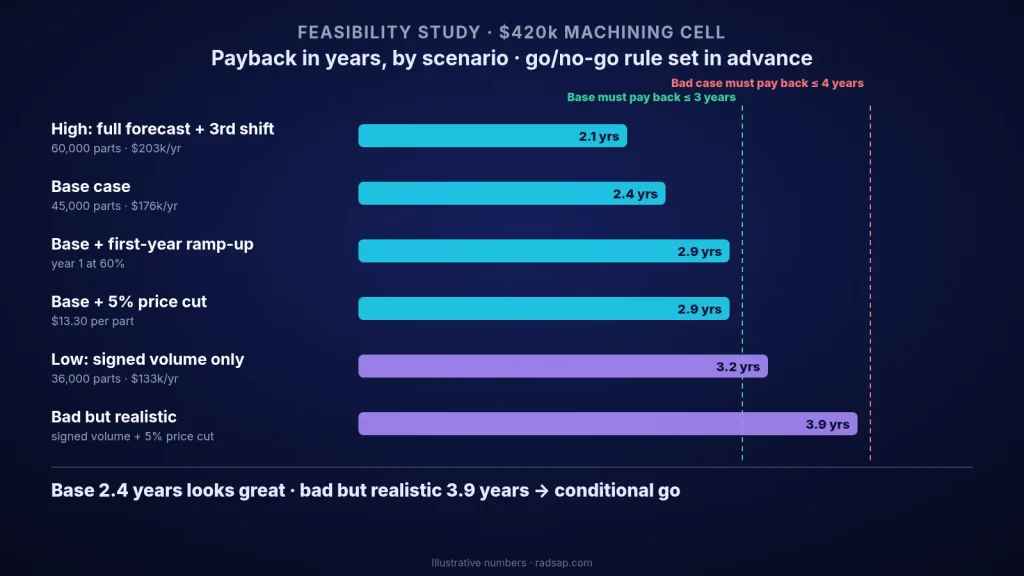
Payback is simply the investment divided by the yearly net cash it brings. In the base case: 45,000 × $4.80 = $216,000, minus $40,000 fixed costs, gives $176,000 a year. $420,000 ÷ $176,000 is about 2.4 years. One number looks good. Now look at the others:
| Scenario (illustrative) | Parts / year | Net cash / year | Payback |
|---|---|---|---|
| High: full forecast, third shift (+$45,000 a year) | 60,000 | $203,000 | 2.1 years |
| Base | 45,000 | $176,000 | 2.4 years |
| Base, first year at 60% ramp-up | 45,000 | $89,600 in year 1 | 2.9 years |
| Base, price cut 5% (to $13.30) | 45,000 | $144,500 | 2.9 years |
| Low: signed volume only | 36,000 | $132,800 | 3.2 years |
| Bad but realistic: signed volume and 5% price cut | 36,000 | $107,600 | 3.9 years |
The picture changes. A normal ramp-up alone adds half a year. A 5% price cut, which buyers often ask for in the second year, does the same. And if both the volume and the price disappoint, the payback is close to four years. For bigger investments I also calculate NPV with the company’s discount rate, but for a decision of this size, payback in scenarios tells the board most of what it needs.
Check 5: risk — and a go/no-go rule agreed in advance
I list only the five risks that could really break the case, each with an owner and one action:
- Demand: the customer takes only the signed volume. Action: base the decision on 45,000, not 60,000.
- Price: a price cut request in year two. Action: fix the price for two years in the contract.
- Ramp-up and part approval: first-article approval takes longer than planned. Action: produce samples on the existing machine before the new one arrives.
- People: no trained operator or setter for two shifts. Action: start training on the current machine now.
- Lead time: the machine arrives in 16 weeks, not 12. Action: plan the start date on 16 weeks.
Then the rule. Write it down before anyone sees the result, so the numbers cannot be bent to fit a decision already made. In this case: go if the base case pays back within 3 years and the bad-but-realistic case within 4 years. The base case is 2.4 years, the bad case 3.9 years. The answer is a conditional go: order the machine only after the contract fixes the price for two years and keeps the signed volume at 36,000 parts or more.
The decision on one page
The whole study fits on one page, and that is what I take to management:
- The question, in one sentence, and the alternatives, including option zero.
- Demand in three cases, with what is signed and what is only expected.
- Capacity at a realistic OEE, and what the existing machines can still do.
- Total investment and the yearly cash that really changes.
- The payback table above, and the five main risks with owners.
- The go/no-go rule, the result and the conditions.
If the answer is go, this page becomes the first input of the project plan, and the people who need to run it can be checked in a weekly capacity board. If the investment is part of a bigger strategy, start one level higher, with value chain mapping, to see whether this is really where the margin is.
Checklist for your next feasibility study
- Demand is split into signed, base and high cases, and the decision stands on the base case.
- Capacity is calculated at a realistic OEE, not the brochure cycle time.
- Option zero, using existing capacity, has been checked and written down.
- The investment includes tooling, installation and training, not only the machine.
- Only cash that really changes because of the decision is counted.
- Payback is shown in scenarios, including ramp-up and a price cut.
- The go/no-go rule was agreed before the numbers were calculated.
Thinking about an investment in your plant?
Send me the idea in a few lines: what you want to buy or build, the expected volume and the rough cost, even without names. We can turn it into a one-page feasibility study, check the three demand cases and the payback in scenarios, and see whether the answer is go, no-go or go with conditions.
Contact me Read: project control Read: resource allocation
Sources
- The structure of an industrial feasibility study (market and demand, capacity, investment and operating costs, financial analysis, risk) follows the UNIDO Manual for the Preparation of Industrial Feasibility Studies.
- Payback, NPV and scenario analysis are standard capital budgeting methods; OEE follows the usual definition of availability × performance × quality. The plant, the customer and all numbers in this article are illustrative only.
- Related reading on this site: project control, resource allocation, value chain mapping and finding the bottleneck.