Most improvement programs I have seen in factories don’t fail in one big moment. They slip a little every week, while every status report says “on track”. By the time someone notices, the program is four months late and the budget for next year is already being discussed.
In 24 years in manufacturing I have run and reviewed many of these programs: an MES rollout, a new warehouse layout, a quick-changeover project, supplier portals, training plans. The problem is rarely a lack of reports. The problem is that the reports measure how people feel about progress, not what has actually been finished.
Below is a light way to build a one-page roadmap and check it every week with one honest number. The program, the projects and every number in this article are illustrative, not data from a real company.
The illustrative case
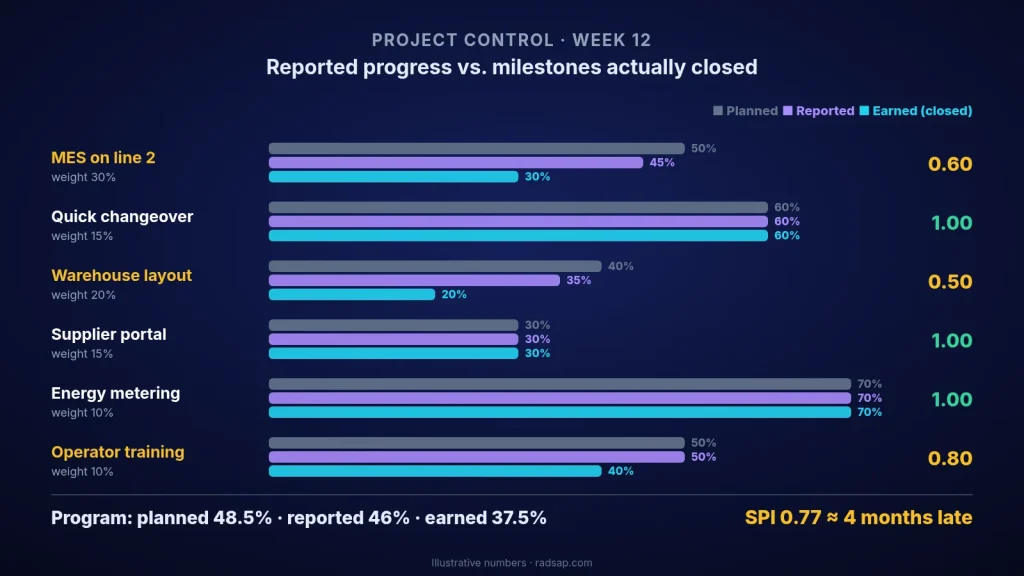
A plant runs a 12-month improvement program with six projects. Every project manager sends a weekly report with a percent complete. At week 12 the reports add up to 46% done, against a plan of 48.5%. Everyone relaxes: two and a half points behind is nothing. When we counted only the milestones that were actually closed, with evidence, the program was at 37.5%.
Step 1: put the roadmap on one page
A roadmap is not a Gantt chart with 400 lines. For management it is one page with a few columns for each project:
- The outcome it must deliver, in one number (for example, changeover time on the press line from 90 to 40 minutes).
- One owner, a person and not a department.
- Its weight in the program, usually its share of the budget.
- Three to five milestones, each with a date and a clear “done” test.
- The one dependency most likely to block it.
If a project can’t be described in one line on this page, it is usually two projects, or it isn’t ready to start.
Step 2: count progress only by closed milestones
This is the rule that changes everything. A milestone counts as 0 until its evidence exists, and then it counts in full. “The software is 80% installed” is 0. “Line 2 runs one full shift on the new system, signed by the production supervisor” is done. This is the 0/100 rule from earned value practice, and it removes most of the optimism from progress reports.
| Week 12 (illustrative) | Weight | Planned | Reported | Earned (closed milestones) | Earned ÷ planned |
|---|---|---|---|---|---|
| MES on line 2 | 30% | 50% | 45% | 30% | 0.60 |
| Quick changeover, press line | 15% | 60% | 60% | 60% | 1.00 |
| New warehouse layout | 20% | 40% | 35% | 20% | 0.50 |
| Supplier portal | 15% | 30% | 30% | 30% | 1.00 |
| Energy metering | 10% | 70% | 70% | 70% | 1.00 |
| Operator training | 10% | 50% | 50% | 40% | 0.80 |
| Program (weighted) | 100% | 48.5% | 46% | 37.5% | 0.77 |
The weighted figures are simple: each project’s percent times its weight, added up. The last column is what earned value calls the schedule performance index. Below 1 means the program is producing less finished work than planned.
Step 3: find where the gap really is
The program is 11 points behind plan (48.5 minus 37.5). Ten of those 11 points come from just two projects: the MES on line 2 and the warehouse layout. Four projects are fine. So the weekly meeting should not discuss six projects equally. It should spend most of its time on two.
When we asked why those two were late, the answer was the same for both: they were waiting for the same thing, clean master data for parts and locations, owned by one overloaded person in IT. Neither status report mentioned it, because each project manager saw only their own delay. I wrote about this kind of dependency in master data ownership before ERP–MES integration.
Step 4: forecast the finish date honestly
If the program keeps producing finished work at 0.77 of the planned rate, a 52-week plan needs about 52 ÷ 0.77 ≈ 67 weeks. That is roughly four months late. Saying this at week 12 is uncomfortable, but it is the cheapest moment to say it. At week 40 there is nothing left to decide.
The forecast is not a prediction. It is a question for management: do we remove the blocker, cut scope, or accept the new date?
Step 5: a 30-minute weekly review and a monthly decision
You don’t need a project office to run this. Two short routines are enough:
- Weekly, 30 minutes: update closed milestones only, recalculate the one number, and talk only about projects below 0.9.
- For each of those, ask three questions: what is blocking it, who can remove the blocker, and by when.
- Monthly, with management: show the program index, the forecast finish date and the top three dependencies, and ask for one decision on each.
If you want those numbers to reach management before it is too late, the same logic as exception dashboards applies: show only what is off track, not a wall of green.
Checklist for your next program review
- One page, one line per project: outcome number, owner, weight, milestones, main dependency.
- Every milestone has a date and a “done” test that someone outside the project can check.
- Progress counts only closed milestones, never “percent felt”.
- One program number every week: earned ÷ planned, weighted.
- Meeting time goes to projects below 0.9, not to all projects equally.
- Shared dependencies across projects are listed in one place, with an owner.
- A forecast finish date is shown every month, with one decision asked of management.
Want an honest picture of your own program?
Send me your current project list with weights and milestones, even rough and with the names removed. We can rebuild it as a one-page roadmap, count what is really finished, and leave you with a forecast date and the two or three decisions your management needs to make this month.
Contact me Read: value chain mapping Read: KPI dictionary
Sources
- Earned value, planned value and the schedule performance index are described in the Project Management Institute’s PMBOK Guide and its Practice Standard for Earned Value Management.
- The 0/100 rule for measuring milestone progress is a common earned value technique for short work packages. The program, the projects and all numbers in this article are illustrative only.
- Related reading on this site: master data ownership, exception dashboards, value chain mapping and the KPI dictionary.