In multi-plant meetings I keep hearing the same fight: Plant A says OEE is 72%, Plant B says 61%, and both teams swear they are right. Scrap, OTIF and “on time” get the same treatment. The numbers look comparable on one slide, but each plant—or each system—uses a different definition. You are not comparing performance. You are comparing dictionaries.
In my 24 years in manufacturing and industrial engineering (M.Sc.), that gap shows up long before the dashboard looks pretty. A plant that excludes changeovers from downtime looks healthier than a sister plant that counts them. A sales OTIF that uses ship date will never match a customer OTIF that uses delivery date. Until you write one shared definition, every review becomes a debate about arithmetic instead of action.
Below is a concrete way to stop that: a one-page KPI dictionary, a worked example with illustrative numbers, and a short checklist you can take to your next operations review.
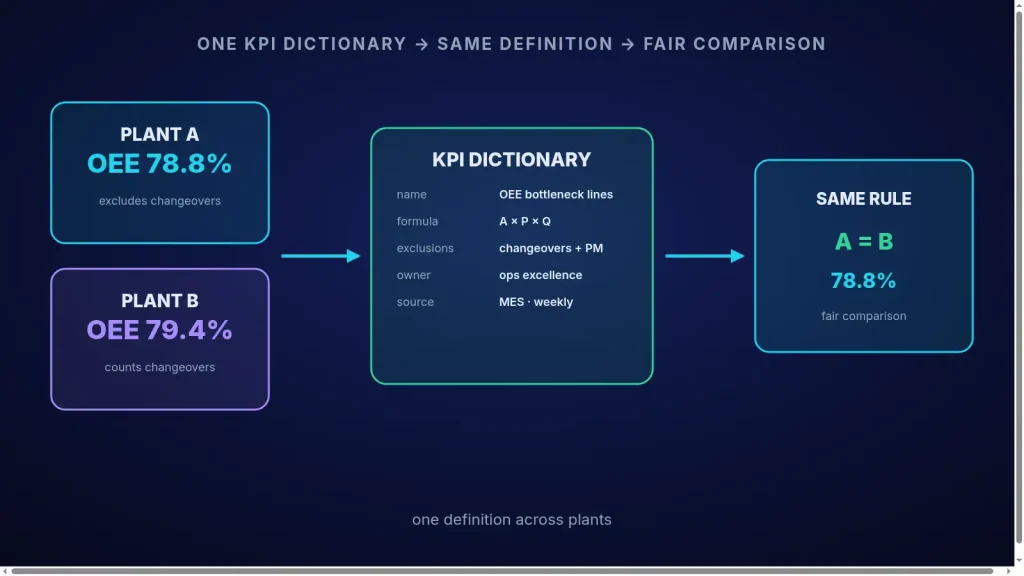
Why plants argue over the same KPI
Standards such as ISO 22400-2 exist because manufacturing KPIs need a formula, a unit, a time window and clear elements—not just a name on a chart. ASCM’s SCOR model treats “perfect order” / on-time reliability the same way: you must say what “on time”, “in full” and “perfect” include before you benchmark anyone. When those fields stay oral tradition, three things usually go wrong:
- Exclusions differ by plant. Planned stops, trials, holidays or “external” waits sit inside Availability in one site and outside it in another.
- Data sources disagree. MES counts good pieces one way; ERP uses order quantity; Excel still has last month’s filter.
- Owners are unclear. Nobody can change the formula without a meeting, so shadow metrics multiply.
If you are cleaning up shop-floor numbers before you visualize them, my note on moving from spreadsheet chaos to one live dashboard pairs with this. For the wider map of capability owners, see why enterprise architecture matters. And if OEE rose while profit stayed flat, definitions and boundaries are often part of the story—see OEE up, profit flat.
Build a one-page KPI dictionary
Keep it boring and short. One page (or one row per KPI) with the same columns for every metric you put on an ops review:
- Name and purpose. What decision this KPI supports in one sentence. “OEE for bottleneck lines, weekly ops review”—not “efficiency”.
- Formula and unit. Write the equation and the unit (% , hours, ppm). Point to ISO 22400 or your internal standard when you align with it.
- Data source and grain. Which system of record, which table or tag, which time bucket (shift / day / week). No “from several reports”.
- Owner and refresh. Named role who may change the definition; how often the number is recalculated; who signs off a change.
- Exclusions and edge cases. Planned downtime list, scrap vs rework, ship date vs delivery date, incomplete orders. This field stops most arguments.
- Publish and retire. Only dictionary KPIs appear on the shared dashboard. Shadow sheets must cite the dictionary ID or stay private.
Worked example: two plants, one OEE, different exclusions (illustrative)
The numbers below are an illustrative example, not data from a real plant. They show how a silent exclusion change moves the headline.
Same line family, same calendar week, same gross available time of 7,200 minutes (5 days × 24 h × 60). Both plants report “OEE”. Both use Availability × Performance × Quality.
| Item | Plant A (example) | Plant B (example) |
|---|---|---|
| Gross available time | 7,200 min | 7,200 min |
| Planned stops excluded from Availability | Changeovers + weekly PM (900 min) | Weekly PM only (300 min) |
| Unplanned downtime | 480 min | 480 min |
| Run time used in Availability | 7,200 − 900 − 480 = 5,820 | 7,200 − 300 − 480 = 6,420 |
| Availability | 5,820 / (7,200 − 900) = 92.4% | 6,420 / (7,200 − 300) = 93.0% |
| Performance × Quality (same example) | 0.88 × 0.97 | 0.88 × 0.97 |
| Reported OEE | ≈ 78.8% | ≈ 79.4% |
| If both use Plant A’s exclusion rule | ≈ 78.8% | Availability 5,820/(7,200−900)=92.4% → OEE ≈ 78.8% |
On the slide, Plant B looks slightly better. After one shared exclusion list for changeovers, the OEEs match—and the meeting can talk about the real 480 minutes of unplanned stop instead of defending formulas. That is the whole point of the dictionary: make the comparison fair before you praise or blame anyone.
The same pattern appears in OTIF. ASCM SCOR’s Perfect Order Fulfillment (RL.1.1) is explicit about complete, on-time, documentation and condition. If Plant A’s “OTIF” is ship-date and Plant B’s is customer delivery-date, you need two dictionary rows—or one agreed row—before you rank them.
What “good” looks like after you publish the dictionary
- Every ops-review KPI has a dictionary ID and a named owner.
- Dashboard tiles link to the definition (tooltip or “i”), not only to the number.
- A short change log: date, field changed, reason, approver.
- New plants or new MES tags must map into the dictionary before they join the multi-plant chart.
For messy process reality before you lock metrics, process mining from the event log often shows where “on time” actually breaks. Governance of definitions is also an EA concern: who owns the data product behind each KPI.
Checklist: one definition across plants
- List the 5–10 KPIs that appear on multi-plant reviews (not every local metric).
- Fill one dictionary row: name, formula, unit, source, owner, refresh, exclusions.
- Resolve exclusion fights in writing; do not leave them to “how we always did it”.
- Point dashboards at dictionary KPIs only; retire or quarantine shadow metrics.
- Re-compare two plants on one KPI after the shared definition—then discuss performance.
- Review the dictionary when systems or shift patterns change (at least twice a year).
Want help aligning definitions across plants?
If your ops reviews keep stalling on “whose OEE is right”, I can help you draft a short KPI dictionary, pick the first handful of metrics, and wire them so every plant reads the same formula.
Contact me Read: from spreadsheets to one live dashboard Read: why enterprise architecture matters
Sources
- ISO. ISO 22400-2:2014 — Key performance indicators (KPIs) for manufacturing operations management — Part 2: Definitions and descriptions.
- ISO. ISO 22400-1:2014 — KPIs for manufacturing operations management — Part 1: Overview, concepts and terminology.
- ASCM (SCOR). Perfect Order Fulfillment (RL.1.1) — reliability metric underlying common OTIF / perfect-order practice.