Ask a simple question in most organizations: "Which systems do we use to manage customer orders, and who owns that process?" Then watch what happens. Three people give three different answers, someone opens an old spreadsheet, and the meeting ends with "let's check with IT." That pause is the clearest sign that a company needs enterprise architecture.
In my 24 years in industry, much of it spent on process maps, organizational design and business analysis, I've seen the same pattern again and again. Every department solves its own problem with its own tool. Each decision makes sense locally. Then, a few years later, the company is paying for overlapping systems, people are copying data between them by hand, and nobody can say with confidence what a new project will break.
Enterprise architecture (EA) is the discipline that stops this drift. Gartner describes it as a way of leading the enterprise's response to change by analyzing how change is executed toward the desired business vision and outcomes. The Open Group's TOGAF Standard, the most widely used EA framework, gives you the methods and vocabulary to do it. I'll keep this article practical: what EA really does for a company, what the lack of it costs in numbers, and how to get started in 30 days without a big program.
What enterprise architecture actually does
Forget the thick binders for a moment. In daily work, good EA answers four questions that management keeps asking:
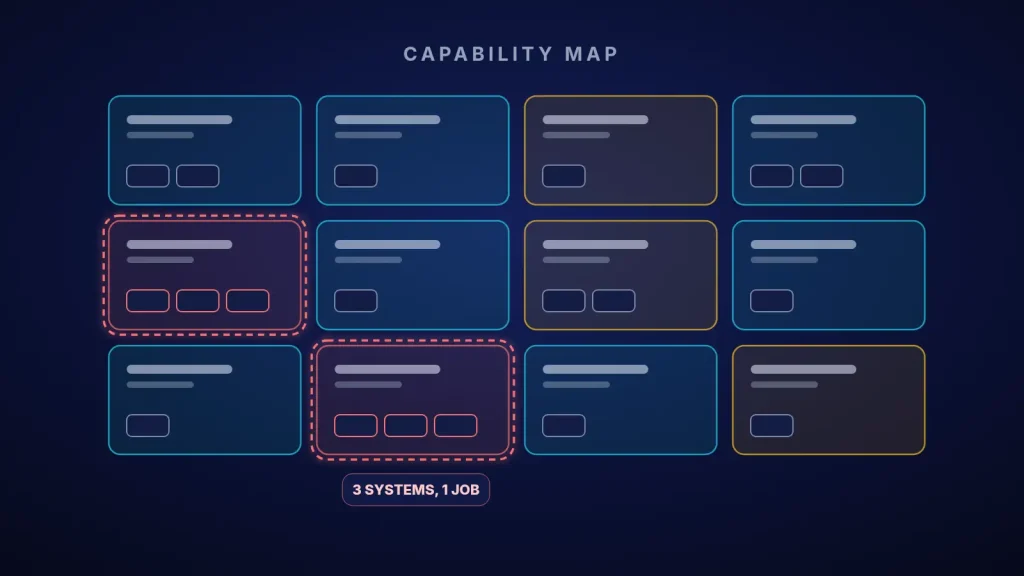
- What do we do? A capability map: the stable list of things the business must be able to do, such as "plan production" or "manage suppliers", independent of who does it today or with which tool.
- With what? Which applications, data and people support each capability, and how healthy they are.
- Where does it hurt? Overlaps, gaps, fragile interfaces and capabilities that matter strategically but are poorly supported.
- What should we change first? A short roadmap that links each investment to a capability and a business outcome.
That's the whole idea. A capability map gives everyone, from the CEO to the IT team, one shared picture of the business. Projects stop being "IT wants a new system" and become "we are strengthening the capability manage supplier quality, which is red on the map."
Worked example: the cost of overlapping systems
Here is an illustrative calculation for a mid-sized company with about 60 business applications. The figures are example assumptions, not data from a real company; plug in your own.
| Cost item | Assumption (example) | Per year |
|---|---|---|
| Duplicate licenses and support | 6 capabilities served by 2–3 overlapping tools × 25,000 extra each | 150,000 |
| Manual reconciliation between systems | 12 people × 4 h/week × 46 weeks ≈ 2,208 h × 15 per hour | ≈ 33,100 |
| Point-to-point interfaces to maintain | 40 interfaces × 1,500 each | 60,000 |
| Total cost of overlap | ≈ 243,100 |
Now suppose a capability map shows that half of this can be removed by consolidating the overlapping tools, with a one-off migration cost of 150,000. The annual saving is about 121,600, so the payback is 150,000 ÷ 121,600 ≈ 1.2 years. After that, the saving repeats every year.
And this table leaves out the costs that are harder to measure but often bigger: wrong decisions made on conflicting numbers, projects that take twice as long because nobody knew which systems they touched, and the risk of a key person leaving with the only knowledge of how things connect. Without a map, you can't even see these costs, let alone reduce them.
A one-page capability map template
You don't need special software to start. A single page or one spreadsheet tab is enough. For a manufacturing company, level 1 often looks like this:
| Capability (level 1) | Owner | Main systems | Health | Strategic importance |
|---|---|---|---|---|
| Strategy and planning | Who decides | Which tools | Green / amber / red | High / medium / low |
| Product development | ||||
| Sales and customer management | ||||
| Procurement and suppliers | ||||
| Production planning and execution | ||||
| Quality management | ||||
| Logistics and warehousing | ||||
| Maintenance | ||||
| Finance and costing | ||||
| People and HR | ||||
| Data and IT |
The magic is in the last two columns. When a capability is red in health and high in importance, that is where your next investment should go. When a capability has three systems in the "Main systems" column, that is your consolidation candidate.
The first 30 days of EA, step by step
- Week 1 – One sponsor, one question. Find a senior sponsor and agree on one business question EA must answer first, for example "Where are we paying twice?" or "What does the new ERP project really touch?"
- Week 2 – Application inventory. List every business application: name, owner, users, yearly cost and the main data it holds. Finance and IT usually have 80% of this already.
- Week 3 – Draw the capability map and link the systems. Use the template above, then place each application under the capabilities it supports. Overlaps and gaps appear on their own.
- Week 4 – Heat map and three decisions. Color each capability by health and importance, present one page to management and leave with three concrete decisions: one thing to consolidate, one gap to fix and one project to re-scope.
The payoff
When EA works, the change is visible quickly. Investment requests are compared on the same map, so budget goes where the business needs it most. New projects start with a clear view of what they will affect, which cuts surprises and delays. Overlapping tools are retired instead of renewed out of habit. And when the company wants to try something new, such as a dashboard or an AI use case, everyone already knows which systems hold the data.
That last point is why I see EA as the foundation for the other topics on this site. I wrote earlier about turning a static architecture into a living model with AI, and about picking the first applied AI use case in manufacturing; both are much easier when a capability map already exists. The same is true for replacing spreadsheet chaos with a live dashboard.
Checklist for this month
- Agree on one business question EA must answer first.
- Name a senior sponsor and one person who owns the map.
- Build the application inventory with owner and yearly cost.
- Draw a level 1 capability map on one page.
- Place every application under its capabilities and mark overlaps.
- Rate each capability for health and strategic importance.
- Do a rough overlap cost with clearly labelled assumptions.
- Take three decisions to management, not a report.
Want a capability map for your company?
If your company has more systems than anyone can explain, or a big project is coming and you're not sure what it will touch, I'd be glad to help. We can build your first capability map together, estimate the real cost of overlaps with your own numbers, and turn it into a short, practical roadmap.
Contact me Read: AI in enterprise architecture
Sources
- The Open Group. The TOGAF Standard, the open enterprise architecture framework, including business capabilities and capability-based planning.
- Gartner. Enterprise Architecture (EA), definition: a discipline for proactively and holistically leading enterprise responses to disruptive forces toward desired business vision and outcomes.