A production manager starts the day with a messy shift report, three WhatsApp messages about a stopped machine and a target that already looks out of reach. ChatGPT will not fix the line. Used well, it turns that pile of notes into a clear picture of where output was lost, in about ten minutes.
After 24 years in manufacturing I have seen good managers lose their first hour every morning just making sense of yesterday. The data is usually there: stop times, counts, queues in front of stations. What is missing is a fast way to sort it and ask the right question. That is where a general AI tool like ChatGPT helps, as long as you give it structured prompts and you stay the one who decides.
Below are 5 ChatGPT prompts for a production manager, in the order I would use them: from a raw shift report to the bottleneck, then to three actions for the morning meeting. The example line and its numbers are illustrative, not data from a real plant.
Before you paste anything: two rules
- Remove what is confidential. Customer names, prices, drawings and personal names stay out. Station names, minutes and piece counts are usually enough. Follow your company’s rules on AI tools first.
- Check the numbers. ChatGPT can make arithmetic mistakes. Ask it to show its calculation, and compare one or two results with the raw report before you act.
The illustrative line
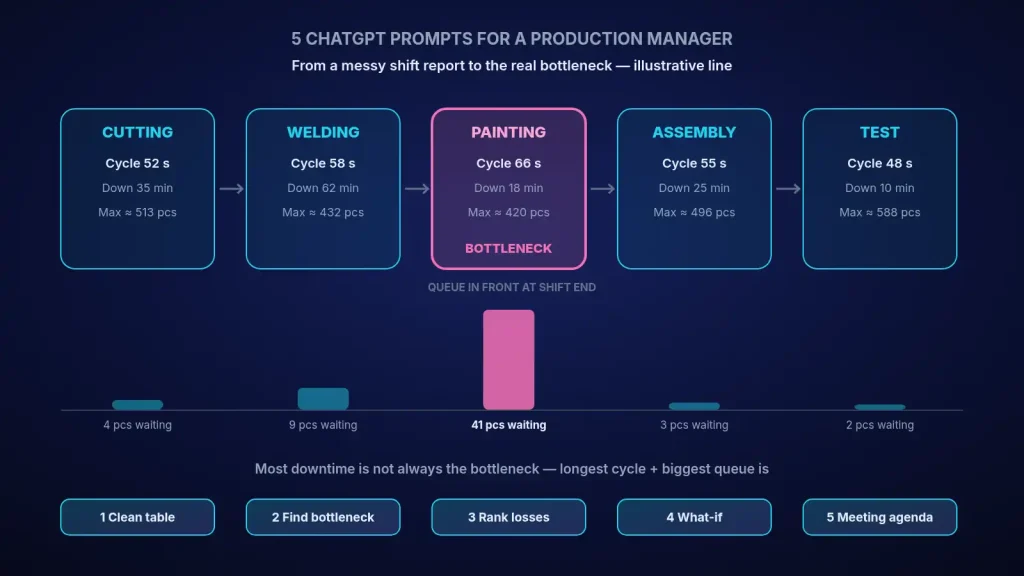
A five-station line runs one 480-minute shift. This is the kind of summary a supervisor can write in a few minutes at the end of a shift:
| Station (illustrative) | Cycle time (s) | Downtime (min) | Queue in front at shift end (pcs) |
|---|---|---|---|
| Cutting | 52 | 35 | 4 |
| Welding | 58 | 62 | 9 |
| Painting | 66 | 18 | 41 |
| Assembly | 55 | 25 | 3 |
| Test | 48 | 10 | 2 |
Most people look at welding first, because it has the most downtime. Keep that in mind while we go through the prompts.
The 5 prompts
- Turn the shift notes into one clean table.
“You are helping a production manager. Below are raw shift notes from a five-station line. Build one table with these columns: station, stop reason, start time, minutes lost, and notes. Do not guess missing values; mark them as ‘missing’. Then list anything that looks inconsistent.”
Paste the notes underneath. The “do not guess” line matters: you want gaps to be visible, not filled with invented minutes.
- Find the bottleneck from cycle time and queues, not from downtime alone.
“Using this table of cycle time, downtime and queue in front of each station, which station limits the output of the whole line? Explain your reasoning step by step and show the calculation of each station’s maximum output in the shift.”
In our example the answer should be painting: it has the longest cycle (66 s) and 41 pieces waiting in front of it. Its maximum is about 420 pieces in the shift (462 available minutes × 60 ÷ 66 s). Welding loses more minutes, but it can still make about 432, so it feeds painting faster than painting can work. This is the same logic I describe in how to find and open a production bottleneck with data.
- Rank the losses that really cost output.
“Now rank yesterday’s stops by their effect on line output. A minute lost at the bottleneck is a minute lost for the whole line; a minute lost elsewhere only matters if it starves or blocks the bottleneck. Give me the top three losses with a one-line reason each.”
This is where the conversation changes. Eighteen minutes at painting cost more finished pieces than sixty-two minutes at welding, as long as welding keeps a queue in front of painting.
- Test one “what if” before you promise anything.
“If we recover 10 minutes per shift at painting (for example a shorter colour change), how many extra pieces could the line make per shift? List your assumptions.”
The arithmetic is simple: 10 minutes is 600 seconds, and 600 ÷ 66 is about 9 extra pieces per shift. The useful part is the assumptions list, such as “upstream keeps painting fed” and “test can absorb the extra pieces”. Check them with your team.
- Write the morning meeting agenda.
“Write a 10-minute shift meeting agenda for the production team. Include: yesterday’s output against target in one line, the bottleneck and why, the top three losses, and three actions with an owner and a deadline. Keep the language plain, no jargon.”
You edit the owners and deadlines; the tool only gives you a clean first draft. Over a few weeks, the same structure turns into a habit, and the meeting gets shorter.
What changes after a week
In the illustrative line, the team’s attention moves from welding to painting. A quick check on colour changes, a buffer rule in front of painting and a short break plan that keeps painting running can be tested within days. None of that needed new software. It needed a better question, asked every morning.
When the same questions repeat every day, that is the sign to move them out of chat and into a simple live view. I explain that step in from spreadsheet chaos to one live operations dashboard. And if you want to see where AI fits beyond prompts, read applied AI in manufacturing: use cases and a first project.
Checklist for using ChatGPT on the shop floor
- Confidential data removed; company AI rules followed.
- One clean table first; missing values marked, not guessed.
- Bottleneck found from cycle time and queues, not from downtime alone.
- Losses ranked by their effect on line output.
- Every number checked against the raw report at least once.
- Actions have a named owner and a deadline; the tool does not decide.
Want to try this on your own line?
Send me one anonymised shift report. We can run these five questions on it together, see whether the bottleneck is where everyone thinks it is, and leave your team with prompts that fit your line. If you prefer a lighter first step, use the free factory data check.
Contact me Read: find the bottleneck Read: OEE up, profit flat
Sources
- Bottleneck logic follows the Theory of Constraints idea that the slowest step sets the pace of the whole system (Eliyahu M. Goldratt, The Goal, 1984). Line data and numbers in this article are illustrative only.
- Related reading on this site: finding a production bottleneck with data, OEE and profit, live operations dashboards, and applied AI in manufacturing.