Every factory I know has a goldmine it never reads: thousands of short notes typed by technicians in maintenance work orders, and hundreds of customer complaints written in free text. Nobody can read them all, so they sit in Excel and nobody learns from them. In this tutorial I show a simple first pass with Python that turns those notes into a clear list of recurring failures, and where it makes sense to bring in data from the web.
In my 24 years in manufacturing I have seen the same failure fixed again and again on the same machine because each repair was a separate line of text that no one connected. A little text mining is often the cheapest way to see that pattern. The plant and all numbers below are illustrative, not data from a real company.
The illustrative case
A plant has about 1,800 maintenance work orders from the last twelve months. Each one has a date, a machine code, the downtime in minutes and a short note such as "oil leak on press 3, changed seal" or "hyd. leakage again, seal". The maintenance manager feels that "leaks" are a big problem, but the report only shows downtime per machine, not per cause. The question is simple: which few failure types take most of the downtime?
Step 1: export the text with its numbers
Text alone is not enough. Export one table where each row has the free-text note plus the columns that give it weight: date, machine or product, downtime minutes, cost or number of returned parts. A plain Excel or CSV export from your maintenance system or complaint register is fine. In the example that is 1,800 rows and four columns.
Step 2: clean the text
Technicians write fast. The same word appears with different spelling, abbreviations, extra spaces and, in Persian text, Arabic and Persian forms of the same letters. A few lines of Python with pandas handle the basics:
import pandas as pd, re
df = pd.read_excel("work_orders.xlsx")  # date, machine, note, downtime_min
def clean(t):
    t = str(t).lower()
    t = t.replace("ي", "ی").replace("ك", "ک")  # Arabic to Persian letters
    t = re.sub(r"[^\w\s]", " ", t)            # drop punctuation
    return re.sub(r"\s+", " ", t).strip()
df["text"] = df["note"].map(clean)
Then look at the 50 most frequent words. That list alone usually tells you more than a year of monthly reports.
Step 3: build a small theme dictionary with your technicians
This is the step that makes the result trustworthy. Sit with two experienced technicians for an hour and group the frequent words into failure themes: "leak", "drip", "seal" and "oil on floor" all mean a hydraulic leak; "sensor", "proximity" and "no signal" mean a sensor fault. Then tag each note with its theme:
themes = {
    "hydraulic leak": ["leak", "drip", "seal", "نشت"],
    "sensor fault":   ["sensor", "proximity", "no signal", "سنسور"],
    "conveyor jam":   ["jam", "stuck", "گیر"],
}
def theme(t):
    for name, words in themes.items():
        if any(w in t for w in words):
            return name
    return "other"
df["theme"] = df["text"].map(theme)
In the example, the first try left about 40% of notes as "other". After two short rounds with the technicians, adding the words they actually use, "other" dropped to about 12%.
Step 4: rank the themes by what they cost
Counting notes is not enough; one long breakdown matters more than ten quick resets. Sum the downtime (or cost, or returned parts) per theme and sort it, a simple Pareto:
pareto = (df.groupby("theme")["downtime_min"].sum()
            .sort_values(ascending=False) / 60).round()
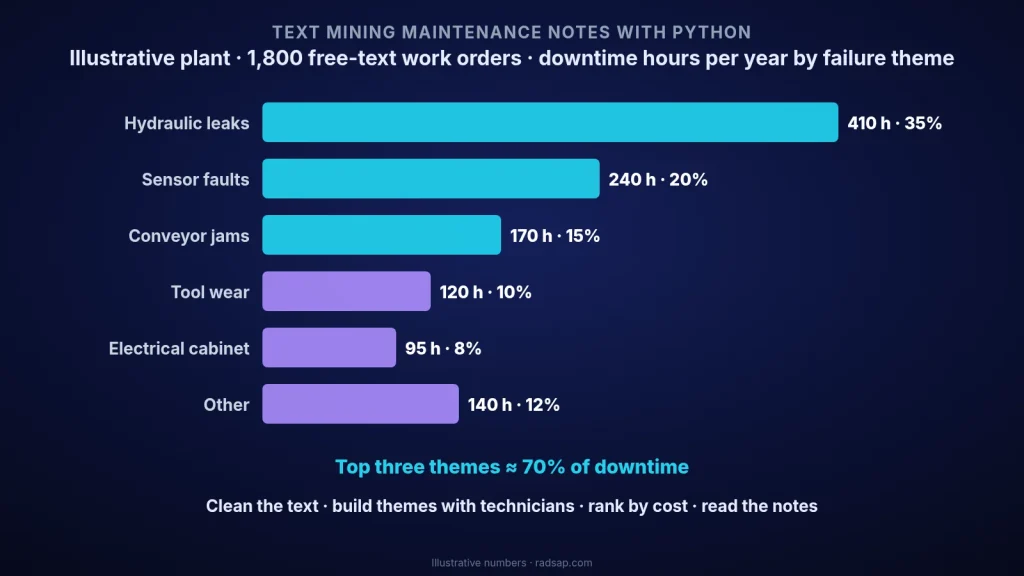
print(pareto) # downtime hours per theme| Theme | Downtime (hours per year) | Share |
|---|---|---|
| Hydraulic leaks | 410 | 35% |
| Sensor faults | 240 | 20% |
| Conveyor jams | 170 | 15% |
| Tool wear | 120 | 10% |
| Electrical cabinet | 95 | 8% |
| Other | 140 | 12% |
In the illustrative plant, three themes take about 70% of downtime, and most of the leak hours come from the seals of two presses. That is a short, concrete list to act on, instead of a general feeling that "leaks are a problem".
Step 5: read the notes behind each top theme
Before you present anything, read 20 to 30 real notes from each of the top themes. You will find tags that are wrong, and you will often find the real story: the same seal part, the same shift, or a repair that was only a quick fix. The numbers point you to the place; the notes tell you what is going on there.
The same steps work for customer complaints
Complaint texts from dealers, call centers or after-sales forms follow the same path: clean, build themes with the people who handle the complaints, and rank by cost or by number of returned parts. Linking a complaint theme to a production date and line is often where the most useful finding is.
A note on web scraping
Sometimes the text you need is outside the company: supplier price lists, competitor product pages, or public reviews. Python can collect these automatically, but do it the right way:
- Use an official API or a download file if the site offers one.
- Read the site's terms and robots.txt, and respect them.
- Go slowly: a few requests with pauses, not hundreds per minute.
- Do not collect personal data, and store only what you need.
A small monthly script that collects the prices of your ten key raw materials from public supplier pages is a good, low-risk first scraping project.
Where it gets harder
The keyword approach above is a strong first pass, and for many plants it is enough to start acting. Things get more specialized when you have tens of thousands of notes, mixed Persian and English text, or themes nobody has thought of yet. Then methods such as text clustering, topic models or language models for classification come in, and the hard part becomes checking that the result is right and linking it to cost and to your maintenance and quality systems. That is the work I usually do with teams.
Common mistakes
- Counting notes instead of cost. Always weight themes by downtime, cost or returned parts.
- Building the theme list alone. Without the technicians' words, too many notes end up as "other".
- Trusting the tags without reading samples. Twenty real notes per theme catch most errors.
- Doing it once. Run it every month, and the dictionary gets better each time.
Text mining fits well with other work I have written about: cleaning factory data in Excel with Claude, finding the real root cause in downtime data, and AI search over factory documents, which also works on company text.
Want to see what your maintenance notes or complaints are telling you?
Send me a short description of your data, for example how many work orders or complaints you have and in which system. Together we can see what a first text-mining pass could show and which failures are worth fixing first.
Contact me Read: real root cause in downtime data Read: cleaning factory data
Sources
- Text cleaning, keyword dictionaries and Pareto analysis of maintenance and complaint records are common first steps in industrial text mining; Python's pandas library is widely used for this.
- Responsible web scraping means using official APIs where available, following site terms and robots.txt, limiting request rates and avoiding personal data.
- The plant, notes and all numbers in this article are illustrative only.