Most companies rank their dealers by one number: sales. The dealer at the top of that list gets the best terms, the most stock and the most attention. Very often it is also the dealer with the oldest unpaid invoices and the most customer complaints. In this article I show the scorecard I use to evaluate a dealer network, so you can see who to grow, who to fix and who to rethink.
In 24 years in manufacturing and planning I have seen many sales networks judged on volume alone, and the result is usually the same: the network grows on paper while cash and reputation leak out at the edges. A fair evaluation looks at what a dealer sells compared with what their area could buy, how they pay, and how they treat your customers. The network and all numbers below are illustrative, not data from a real company.
The illustrative network
A manufacturer sells through 40 dealers. The top 10 by sales bring in 58% of revenue, and every quarter the sales team ranks dealers on that list alone. When we scored the same 40 dealers on the full scorecard below, 3 of the top 10 fell into the "fix" group: their sales were high, but their overdue receivables averaged 61 days and their complaint rate was twice the network average. Meanwhile, 5 small dealers in strong areas turned out to be the best candidates for growth.
The scorecard: six dimensions
| Dimension | What I measure | Weight | Where the data comes from |
|---|---|---|---|
| Sales vs potential | Sales in the dealer's area divided by the area's estimated market potential | 25% | Sales ledger plus a simple market model by area |
| Growth | Sales this year vs last year, same months | 10% | Sales ledger |
| Payment discipline | Average days overdue and share of invoices paid on time | 20% | Receivables report from finance |
| Customer experience | Complaints per 100 units sold and after-sales response time | 20% | Complaint log and service records |
| Standards | Stock of fast-moving items, showroom and staff standards from visit checklists | 15% | Field visit checklists |
| Reporting | On-time sales and stock reports, forecast accuracy | 10% | Dealer reports |
The weights are a starting point, not a law. A company with a cash problem may give payment discipline 30%; a company selling technical products may give after-sales more weight. What matters is that the weights are agreed once, written down and kept for at least a year.
Sales against potential, not sales alone
This is the dimension that changes the ranking most. A dealer in a large city with 2% of the market and a dealer in a small town with 15% of the market should not be judged by the same sales number. I estimate each area's potential from a few public figures (population, number of businesses or vehicles, past sales of the whole category) and compare the dealer's sales with it. I described how to build that kind of area model in geomarketing with Power BI.
How I turn measures into a score
- Fixed thresholds, not ranks. Each measure gets a 0 to 100 score from thresholds agreed in advance. For example, overdue days: 0 to 15 days scores 100, 16 to 30 scores 70, 31 to 60 scores 40, over 60 scores 0. If every dealer improves, every score goes up; nobody has to be last.
- Quarterly, with a rolling 12 months. One bad month should not ruin a dealer's score. I score each quarter on the last 12 months of data, so a real change shows up and a one-off does not.
- A minimum data rule. A new dealer with three months of history is marked "new", not scored low.
- One owner for each number. Sales owns the sales figures, finance owns receivables, after-sales owns complaints. If a dealer disputes a number, everyone knows who to ask.
Four groups, four kinds of action
I put every dealer on a simple two-by-two grid: the total score on one axis and the area's potential on the other.
- Grow (high score, high potential). More stock, better credit terms, joint marketing. These dealers earn the investment.
- Keep (high score, low potential). Good partners in small markets. Keep the relationship healthy and do not push for growth the area cannot give.
- Fix (low score, high potential). The area is worth a lot and the dealer is not using it. Agree a written improvement plan with two or three targets and review it every quarter.
- Rethink (low score, low potential). Not an automatic exit. First ask whether the area needs a dealer at all, whether a neighbouring dealer can cover it, or whether a smaller sales point is enough.
Building it in three weeks
- Week 1: agree the measures. Sit with sales, finance and after-sales, choose the measures and weights, and write the thresholds in one page.
- Week 2: collect and clean the data. One table per dealer per quarter. Most of the work here is matching dealer codes across the sales, finance and complaint systems; an Excel model with a clean dealer list is enough to start.
- Week 3: the dashboard and the first review. One page in Power BI or Excel: the ranked list, the four-group grid and a one-page card per dealer. Then hold the first review meeting with the sales team.
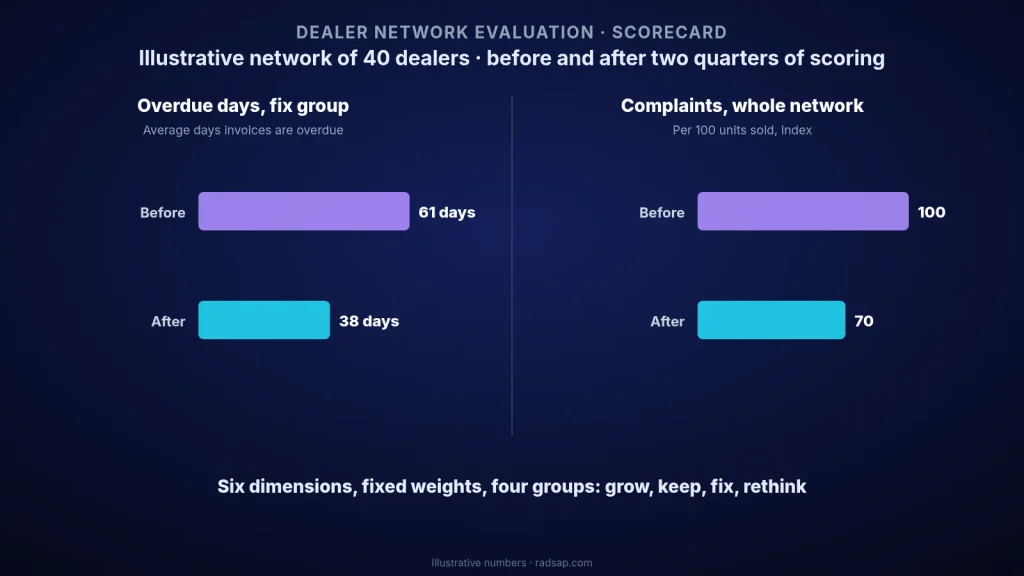
In the illustrative network, after two quarters of using the scorecard in dealer meetings, average overdue days at the "fix" dealers fell from 61 to 38, and complaints per 100 units across the network fell by about 30%. Nothing magic happened. The dealers simply knew, for the first time, exactly what they were judged on.
Common mistakes
- Judging on volume alone. It rewards the dealers in big cities and hides the ones who hurt your cash and your brand.
- Keeping the scorecard secret. Share each dealer's own card with them. A dealer who sees the score can improve it; a dealer who only hears the result will argue with it.
- Changing the weights every quarter. Then nobody can compare this quarter with the last one, and the scorecard loses its credibility.
- Using it only to punish. If the scorecard only leads to warnings and contract cuts, dealers will start to hide data. The grow group must see real benefits.
This scorecard sits well with other work I have written about: geomarketing to estimate each area's potential, one owner for each KPI, and a one-page management dashboard in Power BI where the network's health can sit as one of the top numbers.
Want to evaluate your own dealer network?
Send me your dealer list and the reports you have today. Together we can choose the measures, set the weights and build a scorecard your sales team and your dealers will both accept.
Contact me Read: geomarketing with Power BI Read: who owns each KPI
Sources
- Dealer and channel partner scorecards with weighted dimensions (sales, payment, customer satisfaction, standards) are a common practice in automotive, machinery and consumer goods distribution; each company should set its own measures and weights.
- The network, weights, thresholds and all numbers in this article are illustrative only.
- Related reading on this site: geomarketing with Power BI, KPI ownership and the factory CEO dashboard.